
Databox Reviews & Product Details
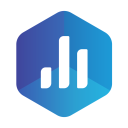
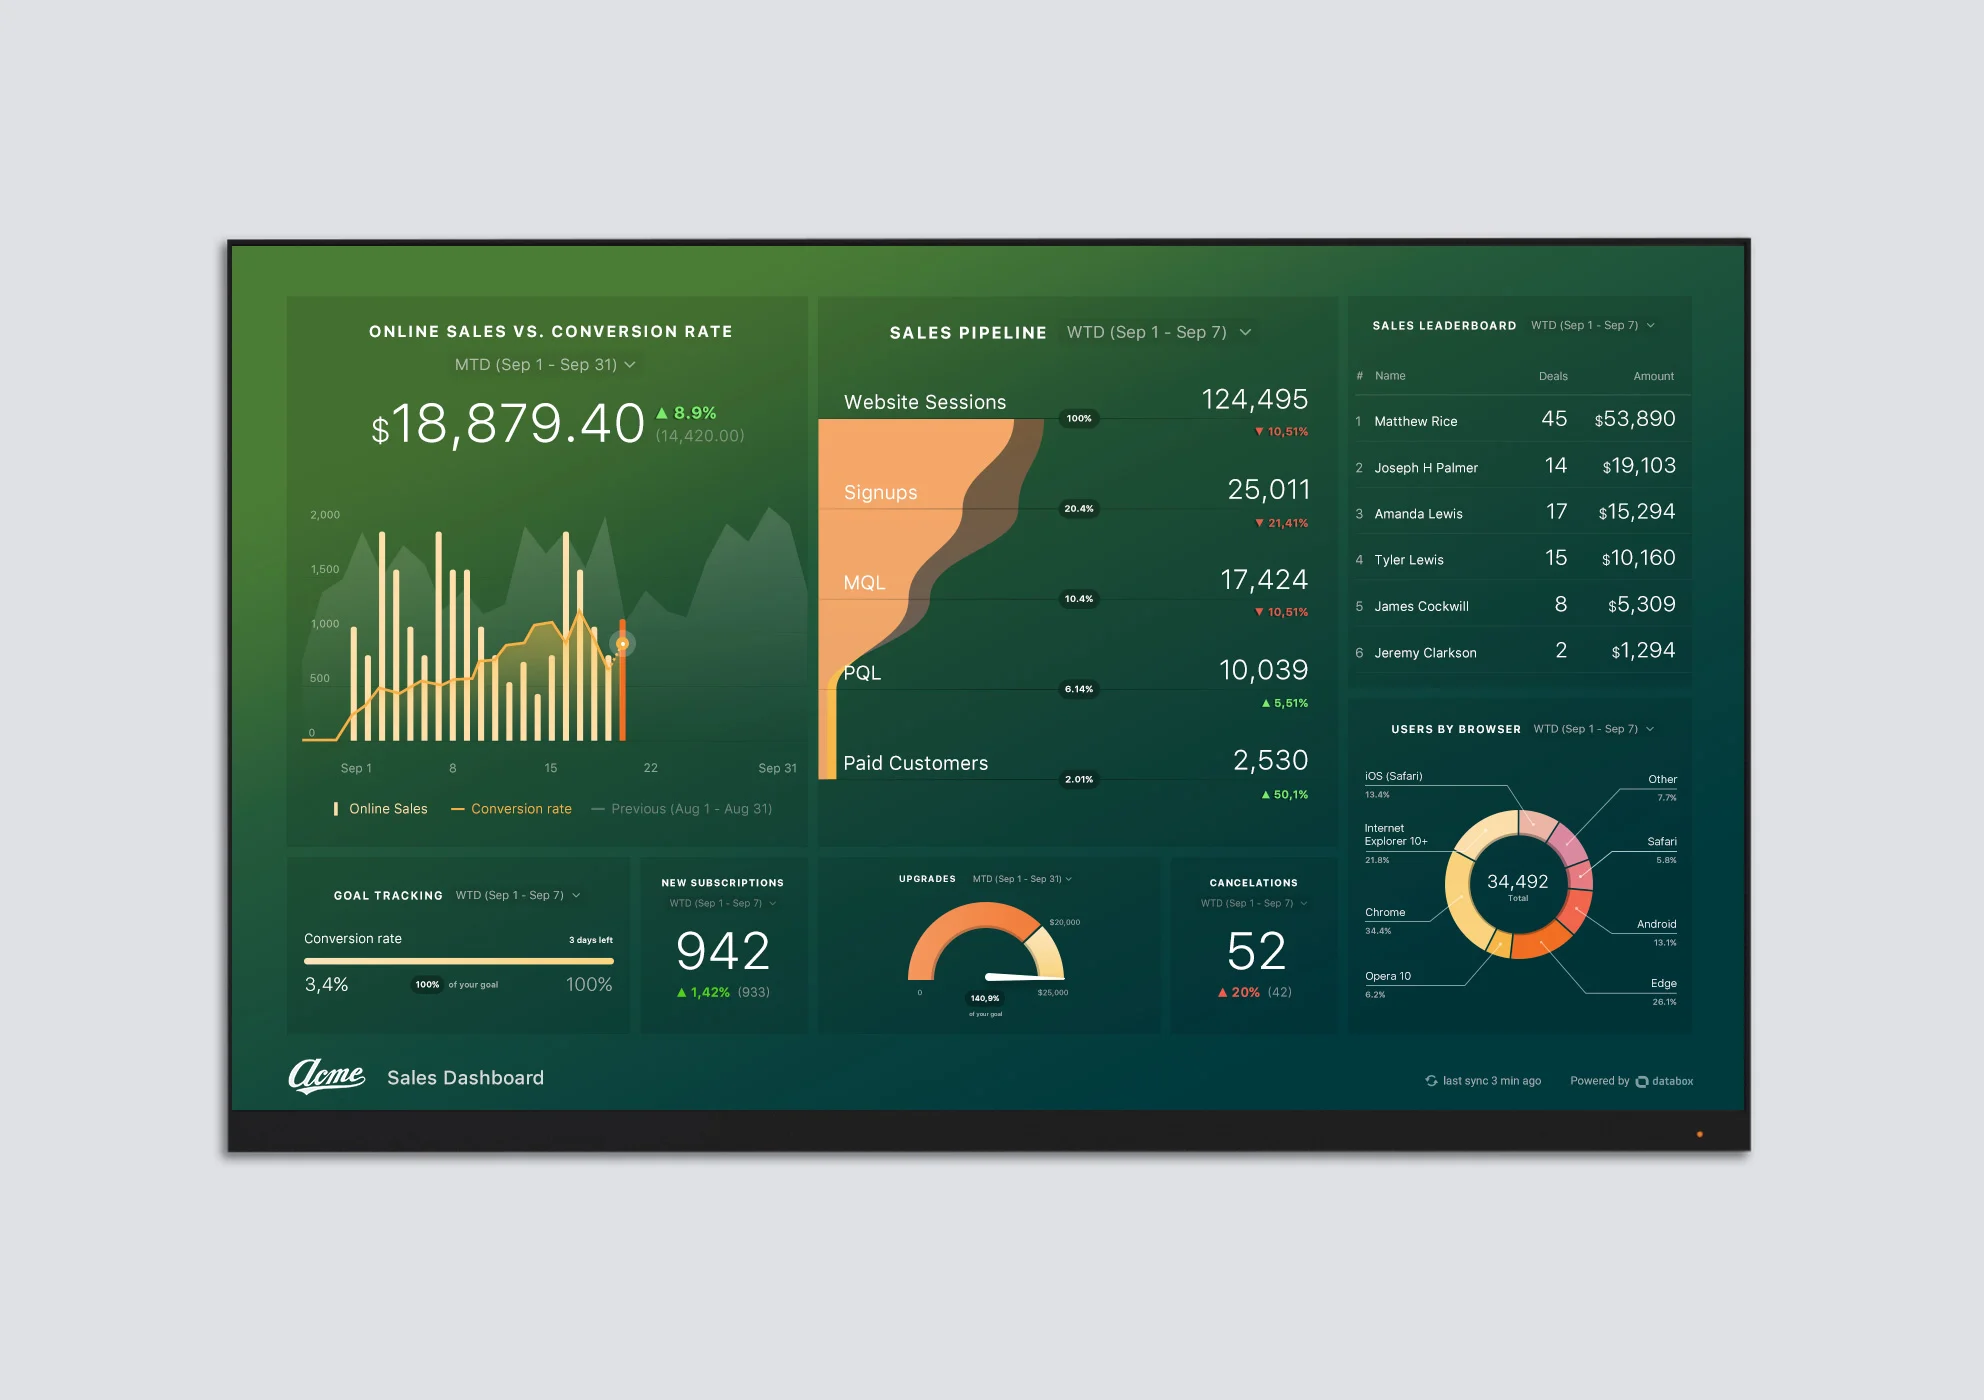
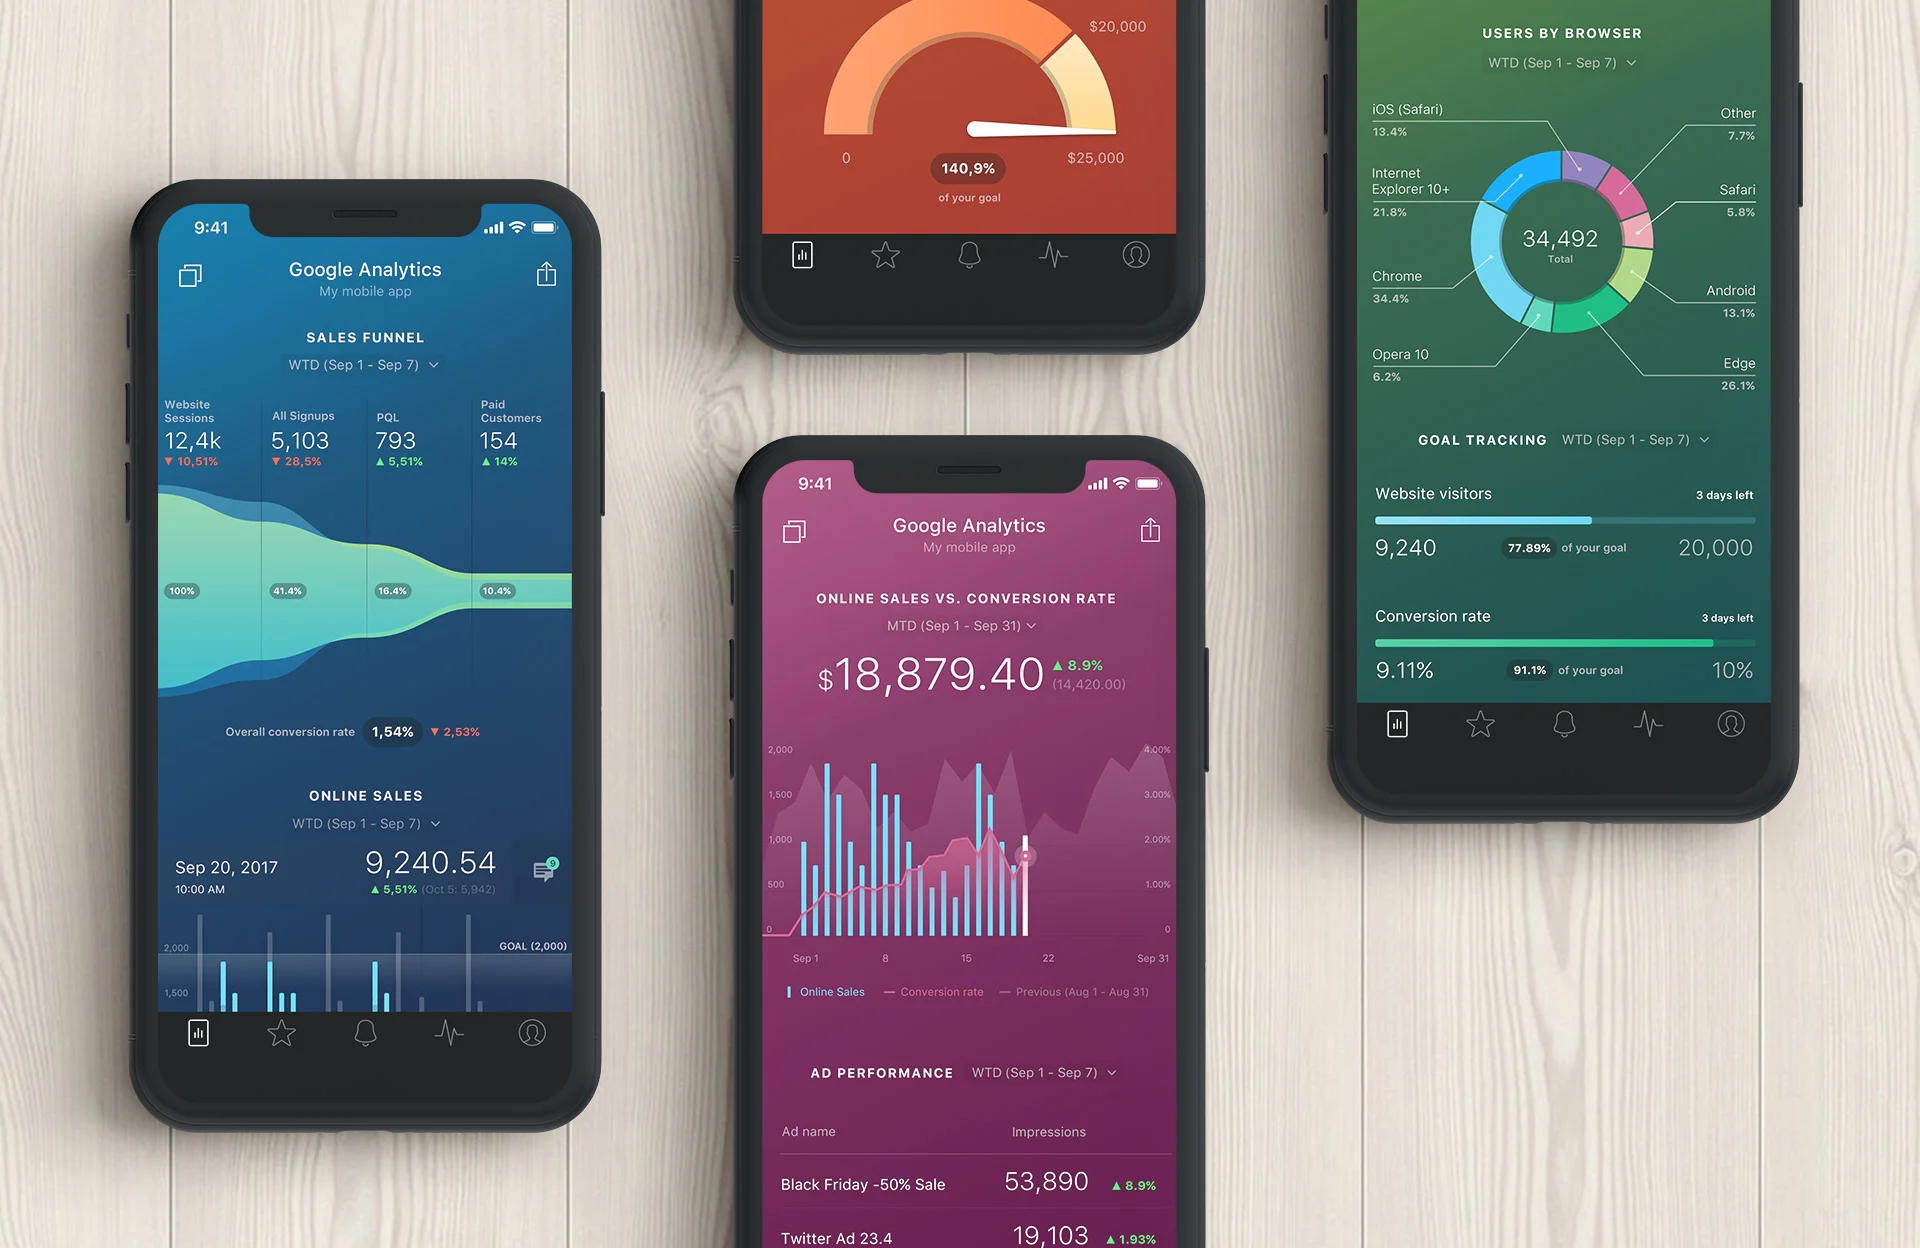
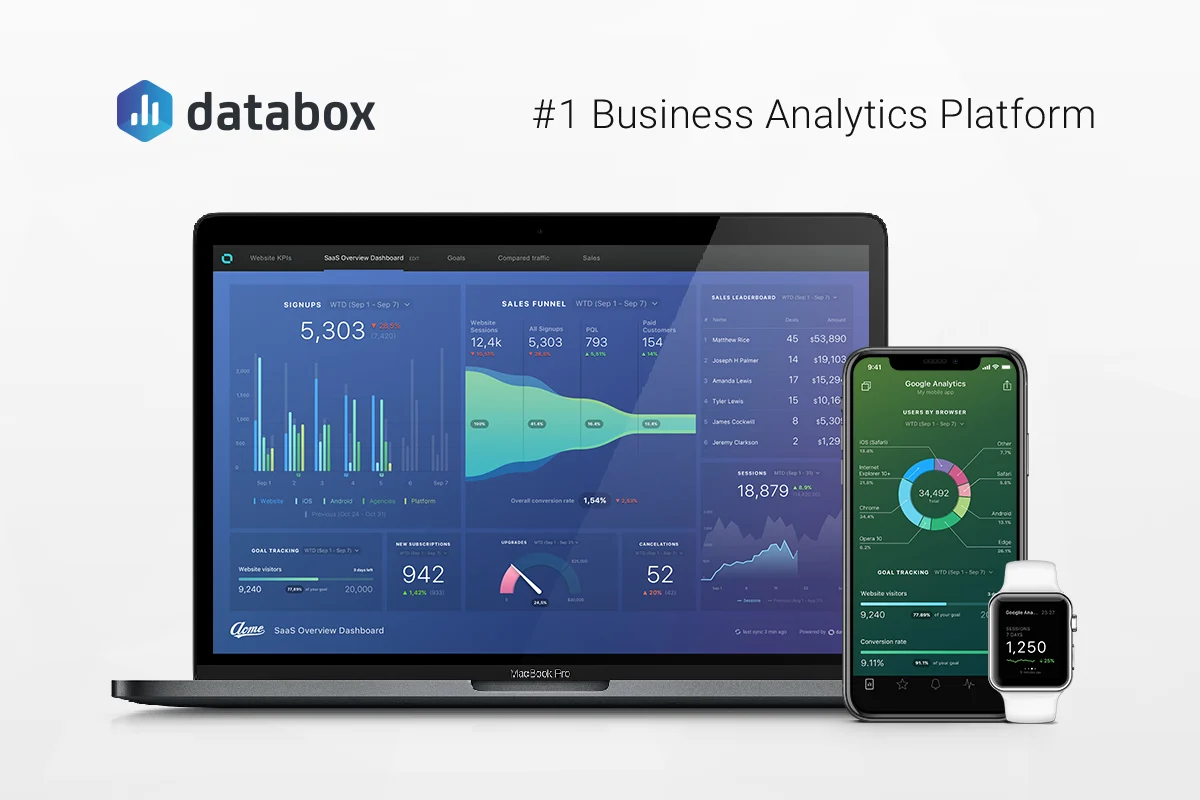
Databox is a cloud-based business analytics tool that lets users create custom analytics dashboards incorporating data from multiple sources, viewable from any device. The platform is specifically designed for high-level executives, analysts, and marketers, and makes navigation easy through single-click integrations, the advanced settings for unique metrics, and time intervals that can be modified and tailored to your needs.

| Capabilities |
|
|---|---|
| Segment |
|
| Deployment | Cloud / SaaS / Web-Based, Mobile Android, Mobile iPad, Mobile iPhone |
| Support | 24/7 (Live rep), Chat, Email/Help Desk, FAQs/Forum, Knowledge Base, Phone Support |
| Training | Documentation |
| Languages | English |


The visual design is gorgeous. Creating and modifying the dashboards is relatively intuitive and easy enough with the grid system.
I really wish it were easier to get to the RIGHT information. The trouble with having so many possible data points makes the process very daunting at times.
Getting a snapshot of our stats in one central location is all we really wanted, and that's exactly what we got.
Interface is perfect, an easy way to see all performance in one app
Limited management of data on favorites, should be able to specify exactly data to show to use one page with all interested data there
Used just to views a resume on ads performance
Flexibility in building dashboards that are both mobile and laptop friendly.
Pricepoint is too high for small startups. Also would like to see shareable library of examples from others.
Daily review of KPIs from Google Analytics. Still early to say, but very handy views of metrics we care about the most. They have a lot more connectors to what I don't use, so options being provided to customers is very comprehensive, especially option to connect to MySQL and Postgresql databases.
Very adaptable solution allowing you to report on almost anything you want as it has so many data sources. They also keep adding new functionality with Reports and Benchmarks recently added. These features will undoubtedly go on to be very, very useful once the 'Beta' phase is complete.
I'm not sure what has happened with the customer support team at Databox but they are fairly unresponsive these days. Formerly they were the best out there, super-helpful and super-responsive (I'd know because the nature of my work means that I consult martech support teams on an almost daily basis) but currently sitting on a query I made 24 hours ago (the Intercom chat bot said 'a few hours') without any communication and this has been a familiar pattern over the last few months. I hope it's just a blip because it would be sad to think that the company are letting this slide.
Off-the-shelf reporting for standard marketing platforms and also a lot of not so standard platforms. Sharing reports is very, very easy.

Best software to track your performance at a glance. Everything is collectively in one place for your organization
Pricing is a little on the expensive side, for access to upgraded tools
Predictive analytics, sharing data, profitability analysis, problem/trend indicators

I like the user friendly interface. I also like how everything flows.
I don't like the transition between sections when a data is created.
With databox, I am solving different evidence based practice for hospital logistics and patient care statistics.
Onboarding takes a couple of minutes. Once you connect data sources you can have useful dashboards in seconds. Daily scorecards are great
A few bugs: notifications not arriving, slackbot down Improvements: scorecard colour coding shows green when negative kpis increase and i don't think you can change this. You can not do calculations using data from 2 sources despite what FAQ says
Dashboards to share with rest of team

The system is very easy to connect multiple data sources together and is very intuitive to use. I've tested other visualisation platforms and dashboard programs and it is fairly safe to say that Databox has been the smoothest from the get go.
Honestly, I think the pricing is not compelling enough for most earlier stage companies. The dashboards are a nice to have and it becomes a much harder proposition for the budget when a tool is a nice to have. The difference between free to the next tier ($60) is significant enough that there are other tools I'd rather spend $720 on. I dislike that there is no native Google Sheets connector which forces me to use Zapier as a stop gap measure.
Trying to get more attention on the KPI's we have as a company and not relying on the old google sheets practice most startups rely on. The KPI's are definitely out there for everyone to see now which is great and people are taking an active interest in what is going on.
I like that there is very little you need to do in terms of normalizing the data in advance. I also like that a number of common data sources are all included as part of your monthly/annual fee. This makes it easy to get started quickly and be able to show insights quickly in a beautiful UI.
I found some of the controls to be a little wonky, as well as some of the limitations of getting the time periods for data to line up, which is as much the data sources variation as anything else. This was more as I got further into more custom metrics I wanted to show, so should not bother the user looking for an out of the box dashboard.
I was looking for a way to bring in various analytics into a single place to share with clients. Clients liked the ability to see these metrics in one place and to be able to more fully discuss success and progress. While we did not have an ROI per se, we did provide a value add that made the clients more confident in their success with us.
Simplicity of connecting to new data sources.
For some integrations (e.g. Teamwork Projects), it requires a separate view for each project vs. a view across all projects.
Quick and simplified views of critical business data.
I like that I can view all of my analytics in one location. I also like that the mobile app contains everything that the web version does. Poorly designed and non-data driven mobile apps is my number 1 reason for cancelling an app subscription.
I don't like that some of the social feeds are limited. For instance, I do not market through my company LinkedIn page, because people don't buy from companies, they buy from people. I market through my personal LinkedIn. However Databox doesn't allow my personal account to be the primary source of data.
We wanted to be able to quantify our results; being able to put hard numbers to what we say has helped us immensely.
The ability to embed the live version of the reports into Hubspot was fantastic. Clients really enjoyed the smooth look and the little bit of extra insight they got from the models.
It is fairly difficult to do custom mapping within the platform. While there are plenty of premade reports, Databox may be pushing more for the added service aspect they offer to build reports for you.
Wanted deeper insights and better looking custom reports for clients across multiple channels and crm instances. We needed a way to better replicate reports that most of our customers needed.
Everything I saw before starting to use it. The potential for a service like this is very appealing. The reality, however, is something else.
The service purports itself to be an easy solution for reporting and data analysis. The truth is that the setup and management or unstable, and difficult to set up. Many of the data sources are not set up for the data history that it carefully states as "up to" which means that you're sometimes getting weeks of data, which is technically "up to 11 months," but not practically usable. Timely customer/tech support is non-existent. I've rarely gotten same-DAY service let alone live support. When you are able to connect with a service person, I have found some to be evasive at best, defensive and argumentative at worst (due to then trying to support a service that doesn't offer much of the benefit they promote and the bait and switch service levels). The bulk of features are in the top service tiers and the lower tiers are there to serve as bait for the bait and switch tactics (see note above about data sources). The pricing menu is missing key restrictions such as custom date ranges. If you want to find any true value from this service expect to pay for the business tier ($248/mo). Even then, the data sources are not complete. There are missing data points and the data history is inconsistent from source to source. My trial was frustrating but I thought I had it set up at a place where it would be usable for monthly reporting. I subscribed to the basic service and discovered the hidden restrictions and the lack of timely support caused me to present incomplete and inaccurate data at a month-end review.
A quick way to collect and consistently visualize all of my different marketing data, and present it in an easy to understand way. It's easy to share and present the data, but getting there is not easy if you can get there at all.
Available to help and assist at all times, and very kind and knowledgeable support.
not much to mention - sometimes heavy load times but nothing too serious
Visualizing the Data properly helps us make crucial decisions in marketing - and databox does it best.
Databox is a great platform to help put all your data in one place. From social media, websites, online advertising - it's amazing. My favorite part is the emails you can sign up to receive whenever you want to stay on top of your data.
I can't think of anything I disliked about Databox. Overall, the process is easy to learn, easy to employment, and easy to share with others on your team/department.
Databox makes getting all my social media and website numbers in one place. I don't have to move through several tabs or websites to get my monthly stats, it's all in one place!
I like how easy the software functions and how easy it makes my life. It is mainly effective for predicting performance in the future and take control. Also lets you take a free trial if you are unsure if the software is for you.
Occasionally software issues do take place making it difficult to use as well as the pricing can be a little expensive.
Databox has been essential for analyzing what is going on in my business hence allowing me to take the correct steps to grow. It has helped with analyzing customer information which has helped decision making through good data visualization. It has also helped the marketing team to analyze the impact on social media which we can then analyze and control for future projects.
It helped me stay very organized and professional
There wasn't much I disliked about it, it just took some getting used to.
I was keeping all my information in a neatly organized way to make things hassle-free.
I can connect any platform and make a panel of KPIs suitable for each one, so that when the information is updated in real time it gives me an indication that the actions that are being carried out have a consequence on visits, purchases or other activities within the website or mobile apps. For example, if I have an activation event, I can quickly notice the panel updates as the activity increases and from where I am getting traffic.
The price goes up a lot when you exceed 5 panels, personally I prefer that there is a price from 2 panels simultaneously in use or that the panels can be activated or deactivated when they are not in use, this because you need a lot of time to configure one and if the platform it asks you to delete it you have to do it without being able to recover them later if you change your plan.
Concentrating all the KPIs of interest in one place was something impossible before knowing and implementing databox, much less having the data updated almost in real time, with databox we are always updated as to what happens with our followers, how they react to contents that we publish or if we are doing something wrong.
Nice visual representations of macro data points across multiple platforms.
Needs more customize-able query options for salesforce and other data platforms.
Databox allows us to house all of our macro data points in one place - great for big-picture company dashboards, etc.